What Is the DMA Trading Strategy?
Contents:
- Principle of double moving average strategy
- Why is the moving average effective?
- Limitations of moving average strategy
- KAMA-Improvement of Kaufman’s adaptive moving average to double average strategy
- DMA strategy logic
- How to start a robot with the DMA strategy?
- Visual DMA strategy displayed by TradingView
- DMA strategy backtest and robustness analysis
Principle of Double Moving Average(DMA) strategy
The moving average was first proposed by American investment expert Joseph E. Granville in the middle of the 20th century. It is still widely used by people and has become an important indicator for judging buying and selling signals. From a statistical point of view, the moving average is the average value of historical prices, which can represent the average price trend of the past N days.
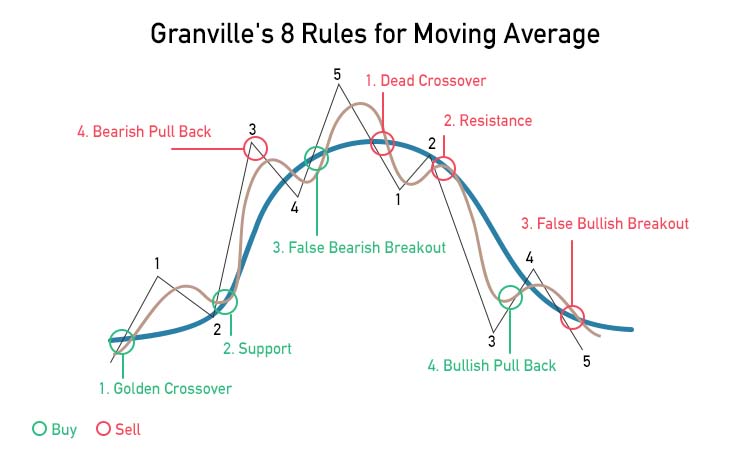
In July 1962, Joseph E. Granville proposed the famous Granville Eight Trading Rules in his book. Only using the price and the moving average can be used for timing, the method is simple and effective. Once published, it was quickly sought after by the market. In particular, the golden crossover and dead crossover signals are still in use today.
Four of Granville’s eight rules are used to judge the timing of buying, and the other four are used to judge the timing of selling. The rules of buying and selling correspond one to one, and they are distributed on the left and right sides of the high point (except buy 4 and sell 4). The rules are as follows:
- Buy 1: The overall moving average shows an uptrend, and the price crosses the moving average from bottom to top, forming the first buying point, which is a golden crossover.
- Buy 2: The price has a downtrend but has not yet fallen below the moving average. At this time, the moving average becomes a support line, forming the second buying point.
- Buy 3: The price is still above the moving average, but showing a sharp downtrend. When the price falls below the moving average, there is a third buying point.
- Buy 4: Both the price and the moving average are in a downtrend, and the price is below the moving average and is seriously far away from the moving average, the fourth buying point appears.
- Sell 1: The moving average changes from a rising state to a slowly falling state, and the price also starts to a dropdown. When the price falls below the moving average, this is a death crossover, forming the first selling point.
- Sell 2: The price is still below the moving average, but the price starts to show an uptrend. When the price is infinitely close to the moving average but has not yet broken through, the moving average becomes a resistance line at this time, forming the second selling point.
- Sell 3: The price has finally broken through the moving average and is above the moving average. But it does not last long, and the price begins to fall until it falls below the moving average again. This is the third selling point.
- Sell 4: Both the price and the moving average are rising, and the price is rising much faster than the moving average. The fourth selling point occurs when the price deviates significantly from the moving average.
Why is the moving average effective?
Shiller (1981) found in his research that the long-term price of assets exhibits the characteristics of average reversion. The price of assets will return to the average value in the long run. This is also the premise that the moving average theory is widely used.
Limitations of moving average strategy
The moving average is essentially an average value, and the biggest issue in the application process of the average value is its hysteresis. When there is a buy or sell signal, the best time is long past. For example, if the latest price of asset A has a large increase, the price and the moving average both are rising, but the rising speed of the moving average is slower than the rising speed of the price. At this time, from a morphological point of view, the golden crossover appears, which is a buying signal. The next day, the price pulls back, and the price drops faster than the moving average, forming a dead crossover, which is a selling point. This kind of buying and selling not only failed to make a profit but also resulted in a loss.
In addition, the speed of price change itself is changing. The traditional simple moving average is trapped by fixed period parameters, which makes the short-term moving average highly sensitive and closer to the price trend regardless of the market trend. However, when the market changes direction repeatedly during a period of market turmoil, it will cause frequent false opening and closing signals. The long-term moving average is more reliable in trend judgment, but it is slow to respond when the market accelerates to rise or fall, which will cause the best buying and selling points to be missed.
KAMA-Improvement of Kaufman’s adaptive moving average to double average strategy
In Smarter Trading, the author Kaufman proposed the “Adaptive Moving Average” (AMA). The moving average takes into account the market price change rate, adds a smoothing coefficient to the ordinary moving average, and adaptively and dynamically adjusts the sensitivity of the moving average, which can self-adjust between slow trends and fast trends.
When the market is consolidating and the trend is not obvious, AMA tends to be a slow-moving average.
When the market fluctuates greatly, the trend is obvious, and the price moves quickly in one direction, AMA tends to be a fast-moving average.
DMA strategy logic
- Calculate the 30-minute period KAMA (120, 250)
- The KAMA(120) crosses the KAMA(250) to open long (close short), and the KAMA(120) crosses below the KAMA(250) to open short (close long)
- Dynamic stop-loss settings monitor the entry price which breaks through 3 times smoothing ATR support real-time stop-loss
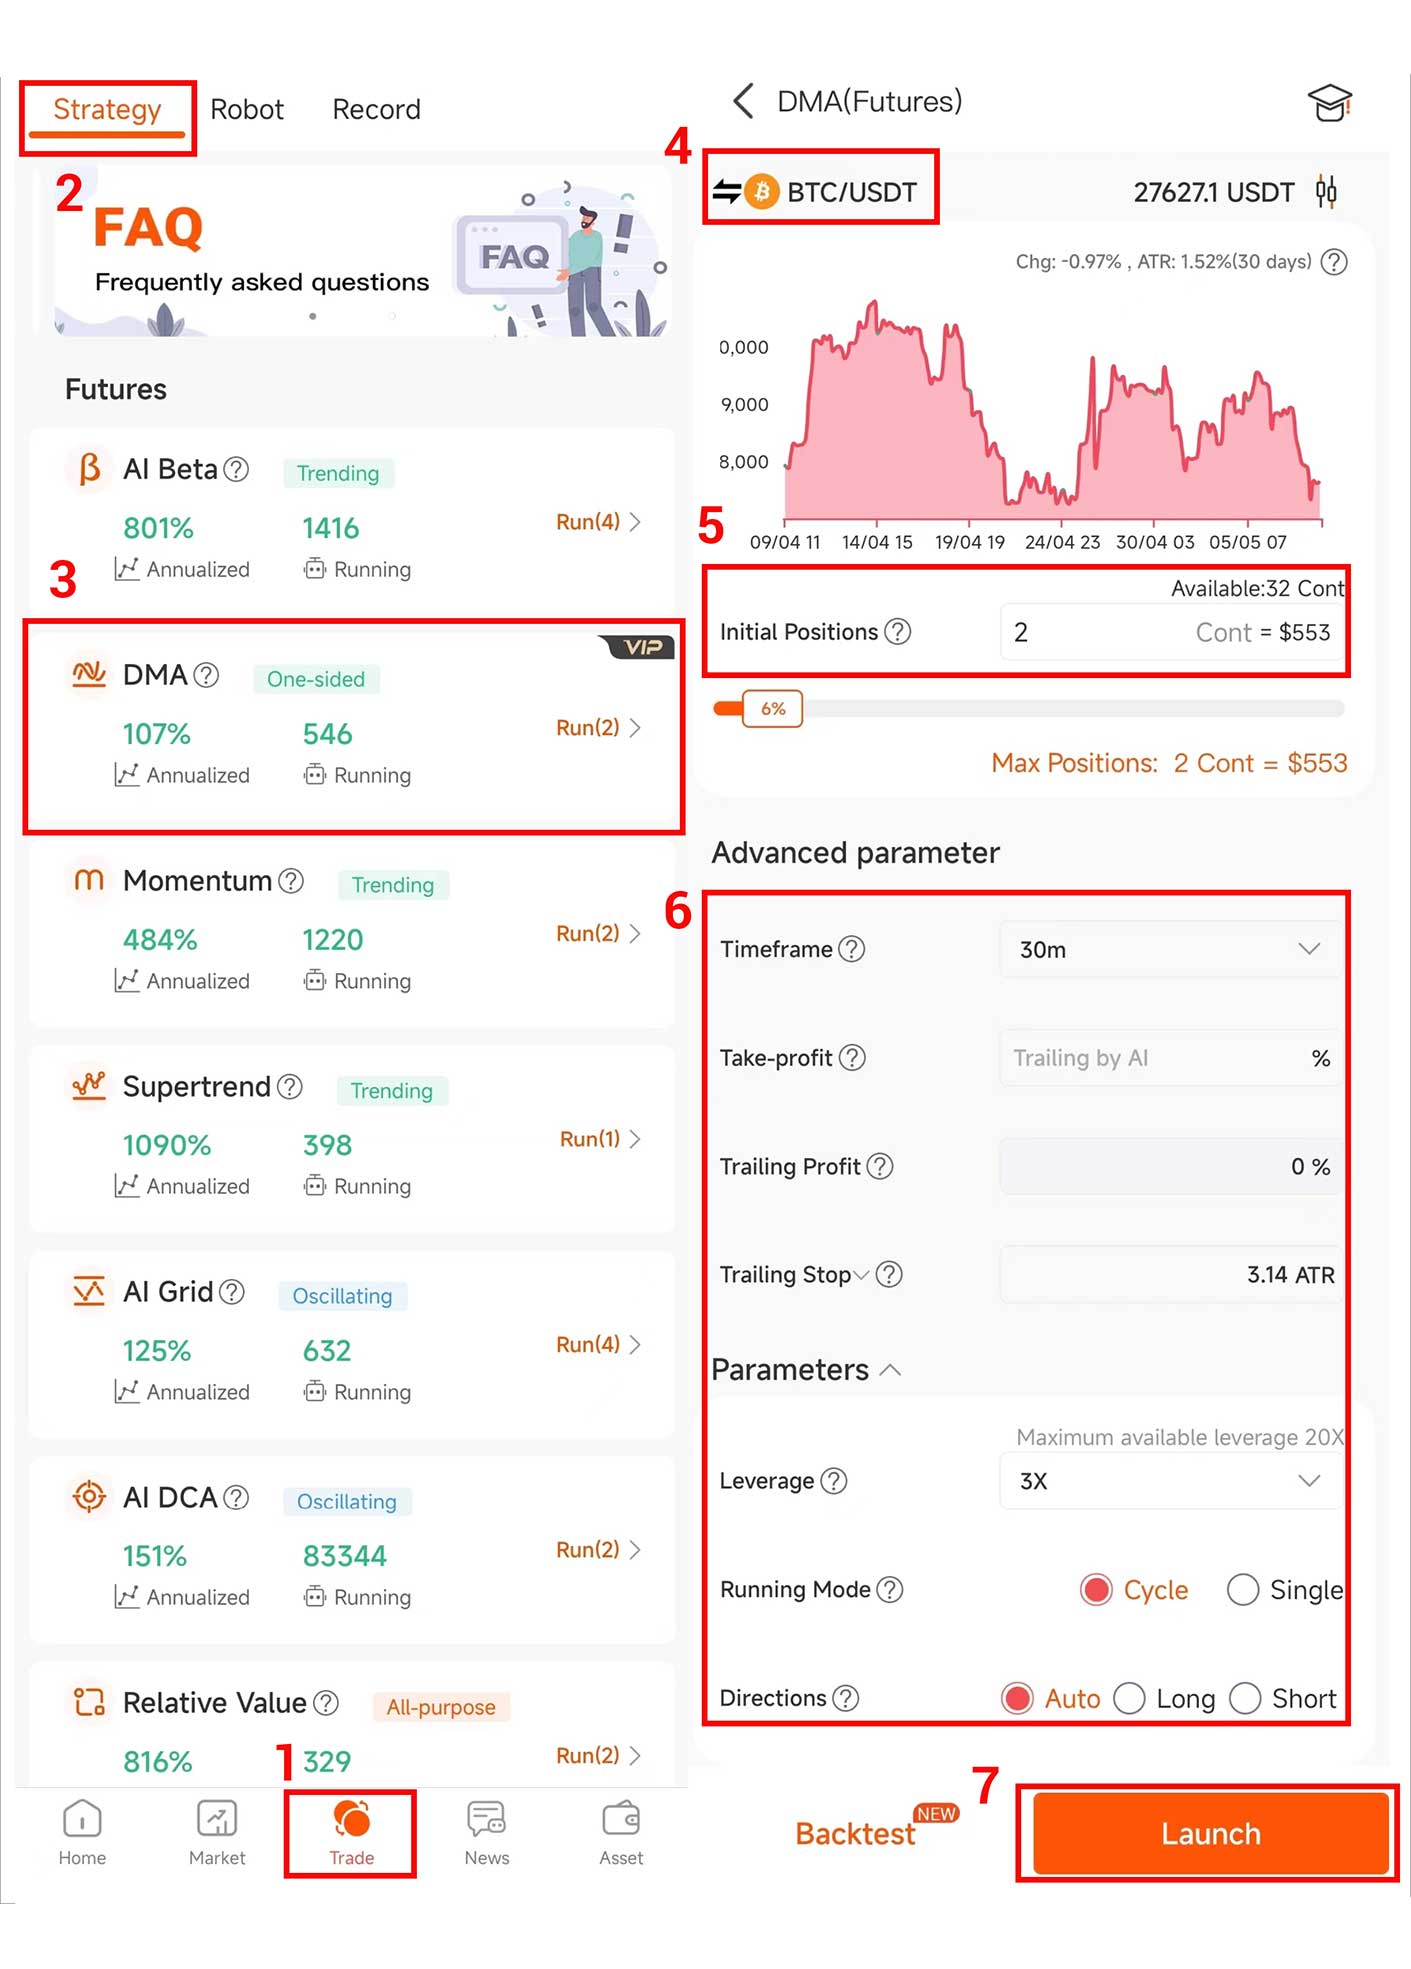
How to start a robot with the DMA strategy?
1. Log into your AntBot account to find [DMA ] in the [Robot] of the [Trades] interface and click the button on the right to enter the parameter setting page.
2. Choose crypto based on personal criteria and preferences.
3. Fill in [Initial Positions].
- [Initial Positions]: The position amount of the robot’s first open position. Beginners are advised to keep the default values.
4. Set [Leverage] [Max order] [Running Mode] [Direction] [Take-Profit] and [Stop-Loss].
- [Leverage]: Using leverage can be regarded as borrowing funds from the exchange to hold positions. The multiple of this position funds relative to the principal is the leverage, and increasing leverage will magnify profits and losses. It is recommended to keep the default value of 5x leverage for beginners.
- [Max Order]: The maximum number that bots are allowed to increase positions consecutively from the state of unopened position.
- [Running Mode]: It is divided into cycle and single. Cycle means that the robot will repeat the next round of opening positions after each take-profit and closing position, and the robot will only stop when it reaches the profit or loss conditions preset in the [Take-Profit] and [Stop-Loss]. Single means that the robot will automatically terminate the operation after completing a cross-position take profit.
- [Auto]: According to the trading signal, going long when a long position signal is released, and going short when a short position signal is released.
- [Long]: Only run long position signal.
- [Short]: Only run short position signal.
- [Take-Profit]
- [AI Tracking] is the default value, the robot calculates the signal every 30 minutes. When the signal reverses, it will take profit and close the positions, and the robot will enter the next cycle.
- If there is a preset ratio value, the robot will close the position and take profit when the rate of return of the robot’s position reaches the preset value, and the robot will enter the next cycle.
- [Stop-Loss]
- [AI Tracking] is the default value, when the robot builds a position, it pre-embeds the stop loss ratio according to the real price fluctuation of the 30-minute period. When the position loss rate reaches this preset value, it will close the position and stop loss, and the robot will enter the next cycle.
- If there is a preset ratio value, the robot will close the position and stop the loss if the loss rate of the robot’s position reaches the preset value, and the robot will enter the next cycle.
5. Click [Launch] to successfully create a DMA robot.
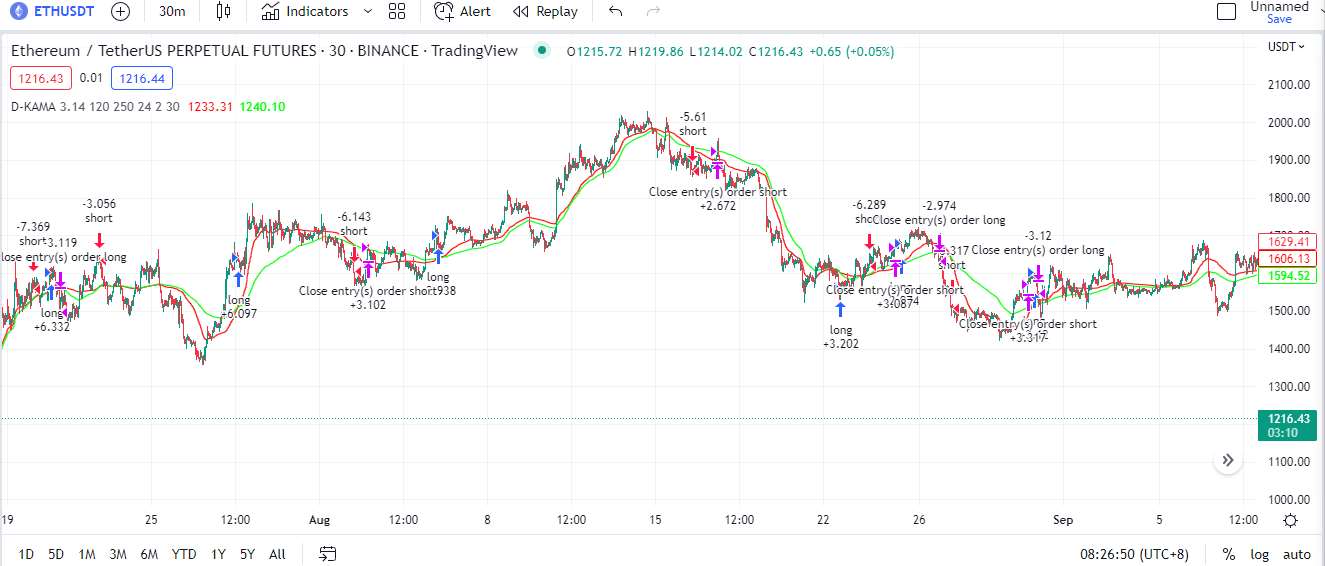
Visual DMA strategy displayed by TradingView
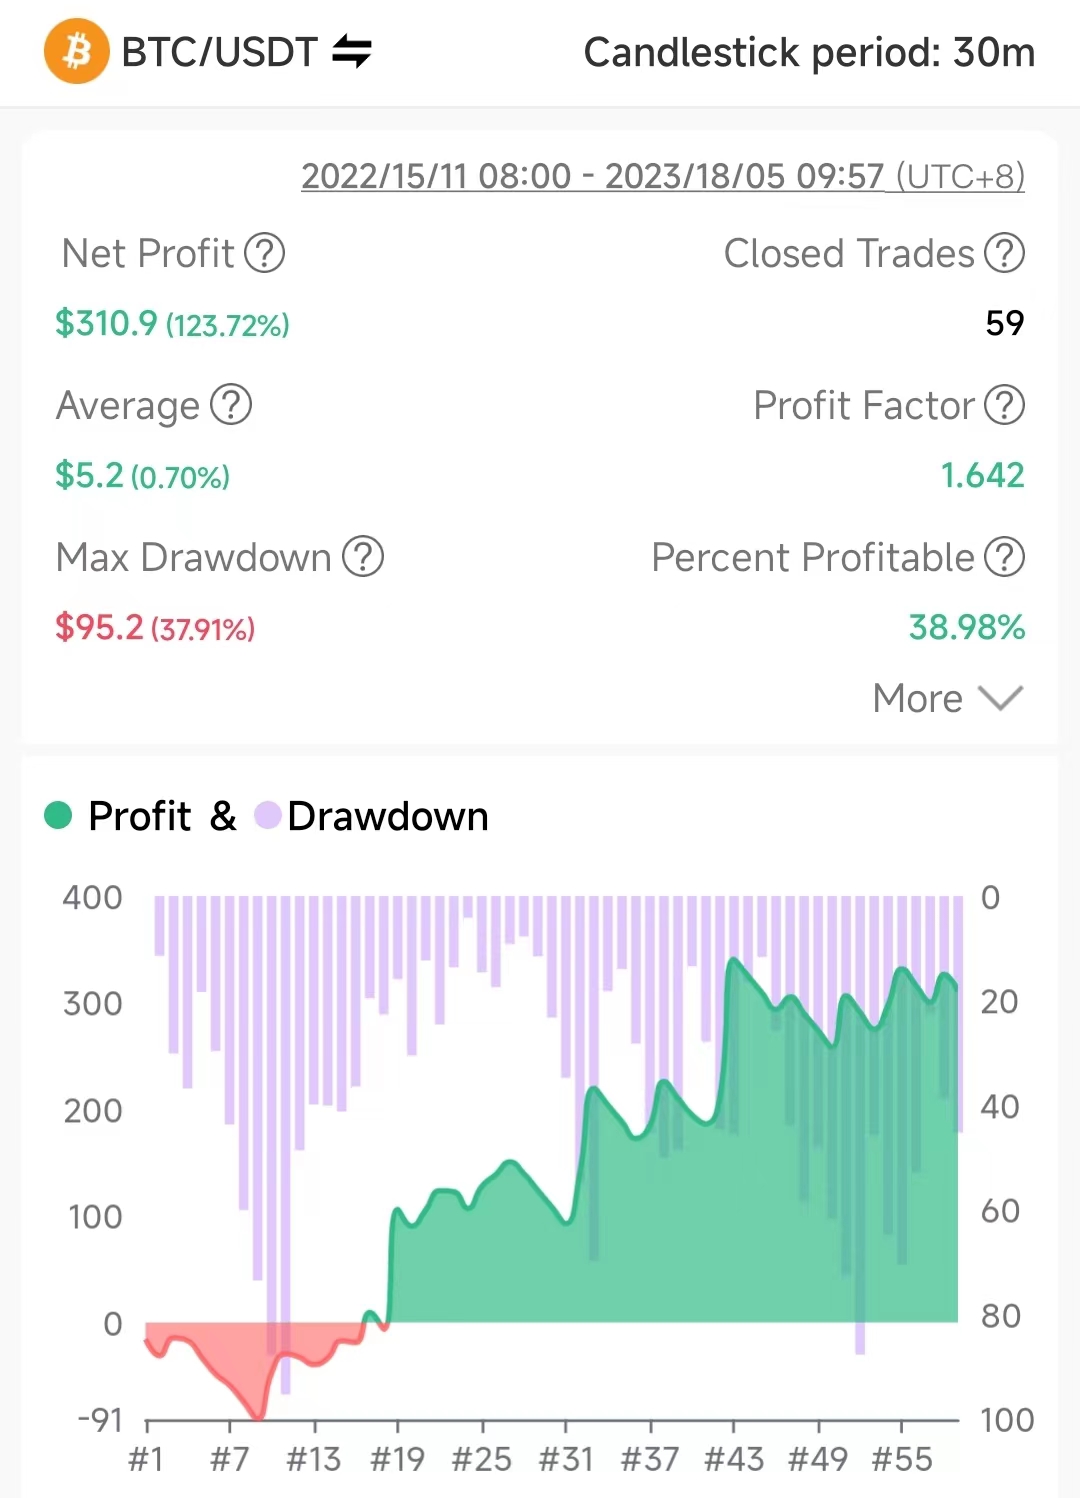
DMA strategy backtest and robustness analysis
Candlestick period: 30 minutes
Crypto: BTCUSDT
Fees: 0.04%
https://school.stockcharts.com/doku.php?id=technical_indicators:kaufman_s_adaptive_moving_average
References:
https://corporatefinanceinstitute.com/resources/equities/kaufmans-adaptive-moving-average-kama/